

24 dollars an hour is how much a year? If you earn $24 per hour and work 40 hours a week for 52 weeks, your gross annual pay is $49,920 before taxes. This 2026 guide breaks down your yearly, monthly, biweekly, and weekly earnings, estimated take-home pay, and how taxes, overtime, and work hours can affect your income.
24 dollars an hour is how much a year: $24 an hour salary calculator
The math: how to convert $24 an hour to a yearly salary
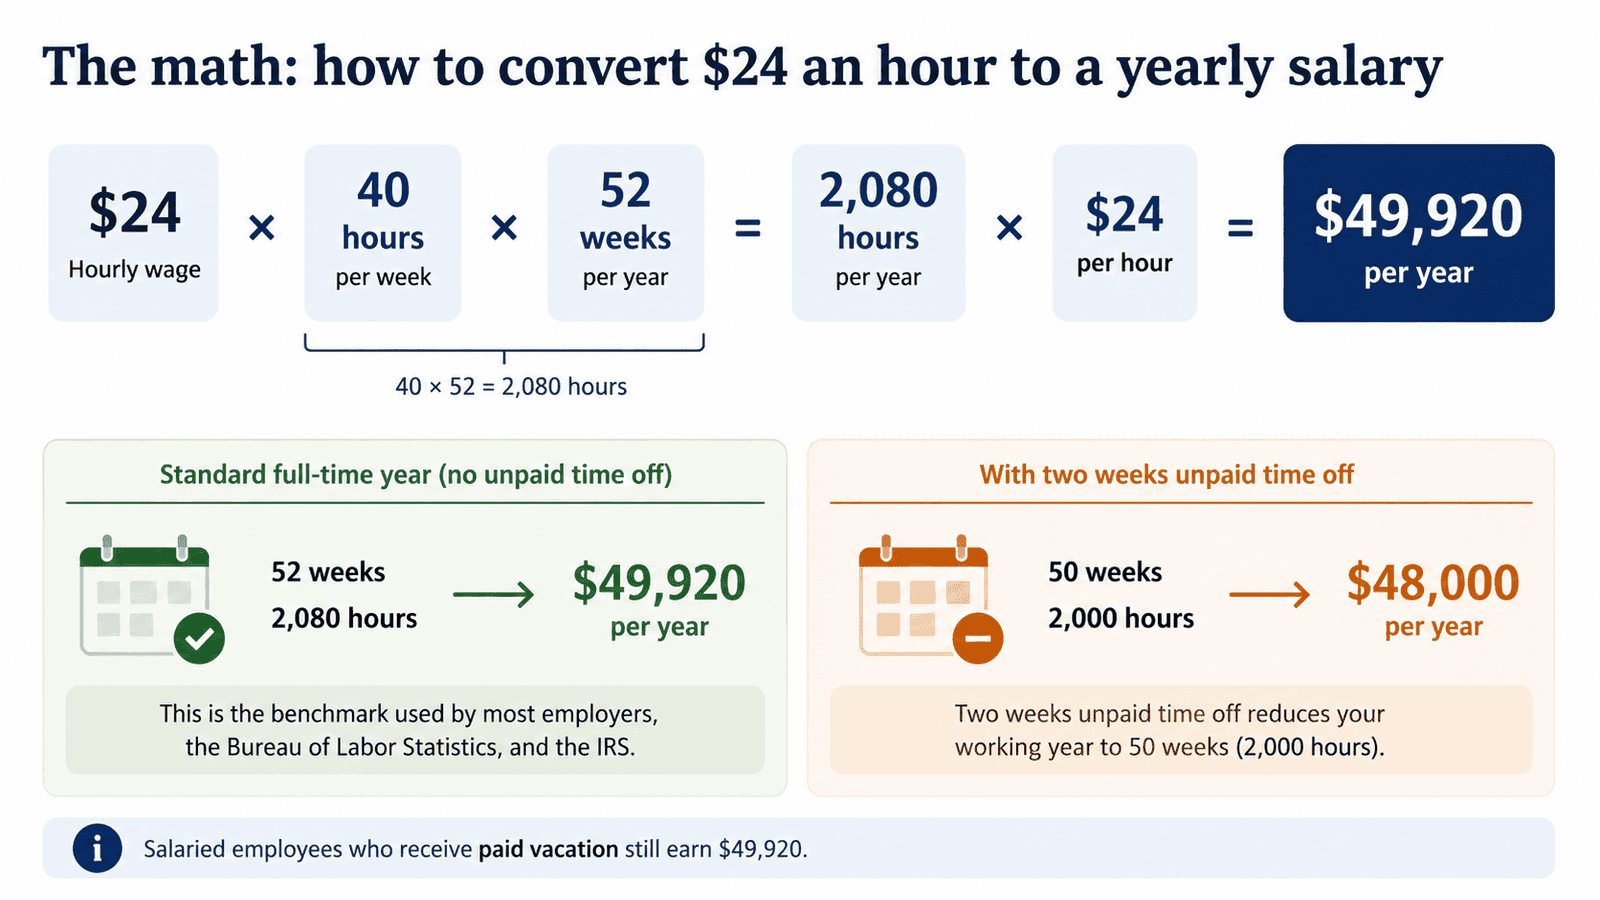
The standard method for converting an hourly wage to an annual salary uses 2,080 working hours per year. That number comes from multiplying 40 hours per week by 52 weeks in a year. Most employers, the Bureau of Labor Statistics, and the IRS treat 2,080 hours as the benchmark for a full time work year.
Keep in mind that 2,080 hours assumes you work every week of the year with no unpaid time off. If you take two weeks of unpaid vacation, your working year drops to 50 weeks and 2,000 hours, bringing the annual total down to $48,000. Salaried employees who receive paid vacation still earn $49,920 because those hours are compensated even when they are not worked.
You can run your own conversion with our hourly to salary calculator.
$24 an hour broken down by pay period
| Pay period | Gross pay (before taxes) | How it is calculated |
|---|---|---|
| Hourly | $24.00 | Base rate |
| Weekly | $960 | $24 × 40 hours |
| Biweekly | $1,920 | $960 × 2 weeks |
| Monthly | $4,160 | $49,920 ÷ 12 months |
| Annual | $49,920 | $24 × 2,080 hours |
If you are paid biweekly, you will receive 26 paychecks per year. Two months out of the year will contain three pay periods instead of two, which can help with budgeting if you plan for those months in advance.
What $24 an hour looks like after federal taxes
Nobody takes home their full gross pay. Federal income tax and FICA payroll taxes reduce every paycheck. The step by step estimate below uses 2026 federal tax rates for a single filer taking the standard deduction, with no dependents and no additional deductions or credits. State and local taxes are not included because they vary widely. If you need a calculation for a different filing status or a specific state, try the salary after tax calculator, or see our Texas paycheck calculator for an example of a state with no income tax.
Step 1: gross annual income
Step 2: subtract the standard deduction
For tax year 2026, the standard deduction for a single filer is $16,100 (IRS Revenue Procedure 2025-32, published 2025). Subtracting the standard deduction from gross income gives you taxable income.
Step 3: apply the 2026 federal income tax brackets
The 2026 federal income tax brackets for single filers are listed below (IRS Revenue Procedure 2025-32).
| Tax rate | Single filer income range (2026) |
|---|---|
| 10% | $0 to $12,400 |
| 12% | $12,401 to $50,400 |
| 22% | $50,401 to $105,700 |
| 24% | $105,701 to $201,775 |
| 32% | $201,776 to $256,225 |
| 35% | $256,226 to $640,600 |
| 37% | Over $640,600 |
With $33,820 in taxable income, only the 10% and 12% brackets apply.
Step 4: calculate FICA taxes
FICA taxes are calculated on your full gross income, not your taxable income after the standard deduction. For 2026 (IRS Publication 926, 2026 edition):
Social Security tax is 6.2% on wages up to the $184,500 wage base. At $49,920, you are well below the cap.
Medicare tax is 1.45% on all wages with no cap.
Step 5: total federal tax burden and take home pay
| Item | Annual amount |
|---|---|
| Gross income | $49,920.00 |
| Federal income tax | $3,810.40 |
| Social Security tax | $3,095.04 |
| Medicare tax | $723.84 |
| Total federal taxes | $7,629.28 |
| Annual take home pay | $42,290.72 |
| Monthly take home pay | $3,524.23 |
Your effective federal tax rate in this scenario is approximately 15.3% of gross pay. This estimate does not include state income tax, local tax, or any pre-tax deductions such as 401(k) contributions or health insurance premiums, all of which would change the final number.
At $24 an hour, a single filer keeps roughly $0.85 of every dollar earned after federal taxes. State income taxes, where applicable, would reduce that further.
$24 an hour working part time
Not everyone works a 40 hour week. If you earn $24 an hour on a reduced schedule, here is how your annual gross income changes.
| Hours per week | Weekly pay | Annual pay (52 weeks) |
|---|---|---|
| 25 hours | $600 | $31,200 |
| 30 hours | $720 | $37,440 |
| 35 hours | $840 | $43,680 |
| 40 hours | $960 | $49,920 |
At 30 hours per week, your annual gross drops to $37,440, which is about $12,480 less than the full time figure. At 35 hours per week, you would earn $43,680 per year. Part time workers should also be aware that working fewer hours may affect eligibility for employer sponsored benefits like health insurance and retirement plans.
How overtime changes your pay at $24 an hour
Under the Fair Labor Standards Act, most hourly employees must receive at least 1.5 times their regular rate for every hour worked beyond 40 in a single workweek. At $24 an hour, your overtime rate is $36 per hour.
If you consistently work 45 hours per week (40 regular hours plus 5 overtime hours), your weekly gross becomes $960 plus $180 in overtime, totaling $1,140 per week. Over 52 weeks, that adds up to $59,280 per year, which is $9,360 more than the standard $49,920.
Even a small amount of regular overtime significantly boosts annual income. Ten overtime hours per week at $36 an hour would add $18,720 per year, bringing the annual total to $68,640.
Is $24 an hour a good wage in 2026
Whether $24 an hour is a “good” wage depends on where you live, your household size, and your financial obligations. Here is how it compares with two important national benchmarks.
The federal minimum wage is $7.25 per hour, a rate that has not changed since July 2009 (U.S. Department of Labor, Fair Labor Standards Act). At $24 an hour, you earn more than three times the federal minimum. Many states set their own higher minimums, but $24 an hour exceeds every current state minimum wage floor in 2026.
The Bureau of Labor Statistics reported median usual weekly earnings of $1,233 for full time wage and salary workers in the first quarter of 2026 (BLS, Usual Weekly Earnings, Q1 2026 news release). Dividing $1,233 by 40 hours gives an approximate median hourly equivalent of $30.83. At $24 an hour, you earn about 78% of the national median, which means the typical full time worker in the United States earns somewhat more.
In lower cost areas of the country, $24 an hour can cover basic expenses comfortably for a single person. In higher cost metro areas such as New York, San Francisco, or Los Angeles, $49,920 per year will likely feel tight, especially after taxes, rent, and transportation costs. For context on comparable hourly wages, you can explore what $23 an hour or $25 an hour looks like annually.
Sample monthly budget on $24 an hour
Using the estimated after tax monthly income of approximately $3,524 (federal taxes only, single filer), here is a sample budget based on the 50/30/20 guideline. This rule of thumb allocates 50% of take home pay to needs, 30% to wants, and 20% to savings and debt repayment.
| Category | Percentage | Monthly amount | Examples |
|---|---|---|---|
| Needs | 50% | $1,762 | Rent or mortgage, utilities, groceries, insurance, minimum debt payments, transportation |
| Wants | 30% | $1,057 | Dining out, entertainment, subscriptions, hobbies, travel |
| Savings and debt repayment | 20% | $705 | Emergency fund, retirement contributions, extra debt payments |
This budget does not account for state income taxes, which would reduce your take home pay further in most states. In states with no income tax, such as Texas or Florida, this breakdown would closely reflect your actual monthly spending power.
Frequently asked questions
Is $49,920 a year middle class?
Definitions of middle class vary, but the Pew Research Center generally defines middle income as roughly two thirds to double the national median household income. For a single person household, $49,920 falls within that range in many parts of the country. In expensive metro areas, it may land closer to the lower boundary. Household size and local cost of living are the biggest factors.
How much is $24 an hour per day?
On a standard eight hour workday, $24 an hour equals $192 per day before taxes.
Can I live on $24 an hour?
A single person with no dependents can typically cover essential living expenses on $24 an hour in many U.S. cities, though it requires careful budgeting. In the highest cost markets, you may need a roommate or supplemental income to stay comfortable. Lower cost regions offer significantly more breathing room at this wage.
How does $24 an hour compare with nearby wage levels?
Small changes in hourly pay add up over a full year. At $21 an hour you would earn $43,680 per year, while $22 an hour brings in $45,760. A bump to $25 an hour raises the annual total to $52,000. Each additional dollar per hour adds $2,080 to your yearly gross income.
Does this estimate include state taxes?
No. The after tax calculation above covers federal income tax and FICA only. Most states impose their own income tax, which would reduce take home pay further. A few states, including Texas, Florida, and Washington, have no state income tax. Use a state specific tool like our Texas paycheck calculator to see the difference.
Methodology
All calculations on this page use the standard full time assumption of 2,080 working hours per year (40 hours per week multiplied by 52 weeks). Federal income tax estimates use the 2026 marginal tax brackets and the 2026 standard deduction for a single filer as published by the IRS in Revenue Procedure 2025-32. FICA rates (6.2% Social Security on wages up to the $184,500 wage base and 1.45% Medicare on all wages) are sourced from IRS Publication 926, 2026 edition. The federal minimum wage of $7.25 per hour is set by the Fair Labor Standards Act and has been unchanged since 2009.
The median weekly earnings figure of $1,233 comes from the Bureau of Labor Statistics Usual Weekly Earnings news release for Q1 2026. Overtime pay is calculated at 1.5 times the regular hourly rate per the Fair Labor Standards Act. All figures are rounded to the nearest cent where applicable.
This content is for educational purposes only and does not constitute personalized financial advice. Consult a qualified financial advisor for guidance specific to your situation.
By Nathan Whitmore for MoneyFN

Nathan Whitmore is a US based personal finance writer at MoneyFN covering salary, paycheck, and tax math for American workers. He works from primary sources only: IRS revenue procedures, Bureau of Labor Statistics wage data, and Federal Reserve statistics. Every figure he publishes is dated and traceable to a public source.